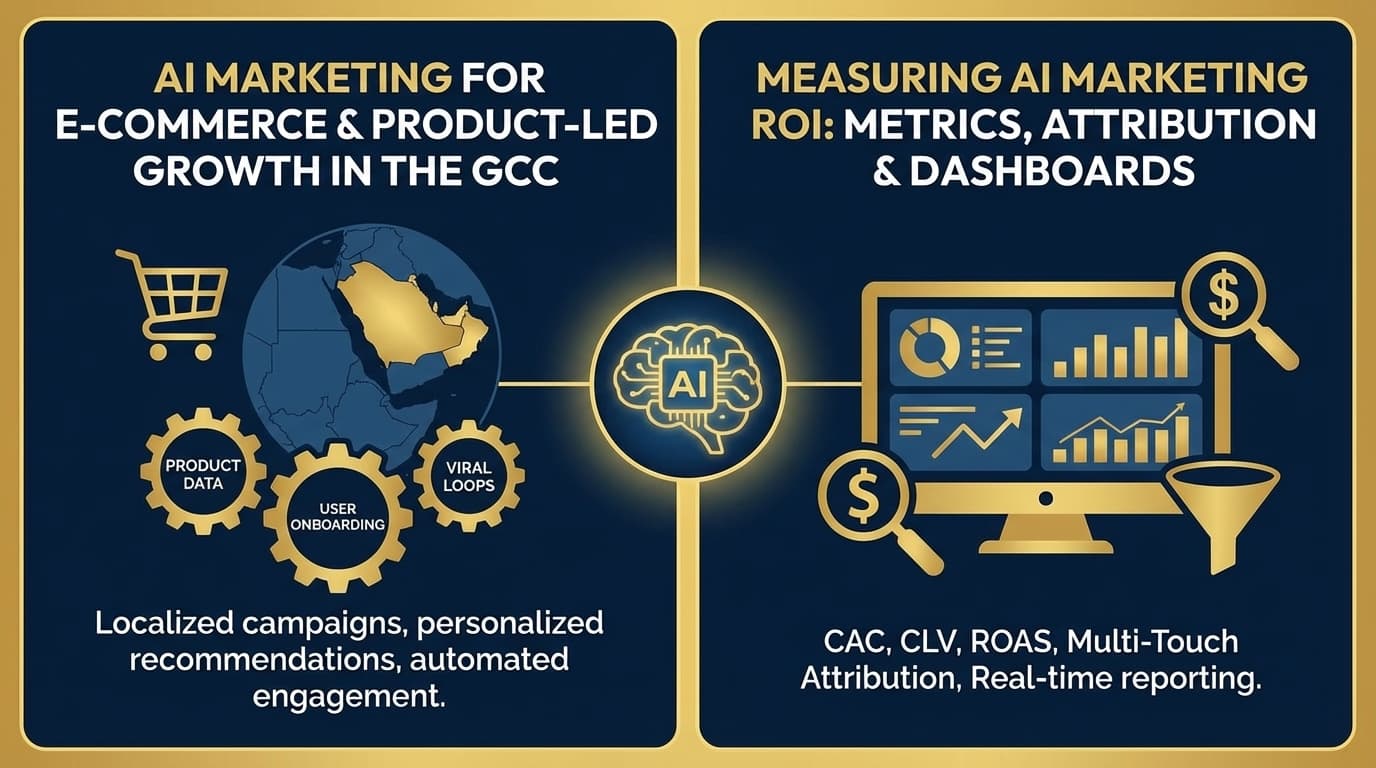
Measuring AI marketing ROI requires tracking three distinct layers: campaign performance metrics like ROAS and CPA, pipeline impact indicators such as MQLs, SQLs, and conversion rates, and business outcomes including revenue lift, customer acquisition cost, and lifetime value. As of 2026, fewer than 40% of marketing teams can prove the return on their AI investments — here is the framework that closes that gap.
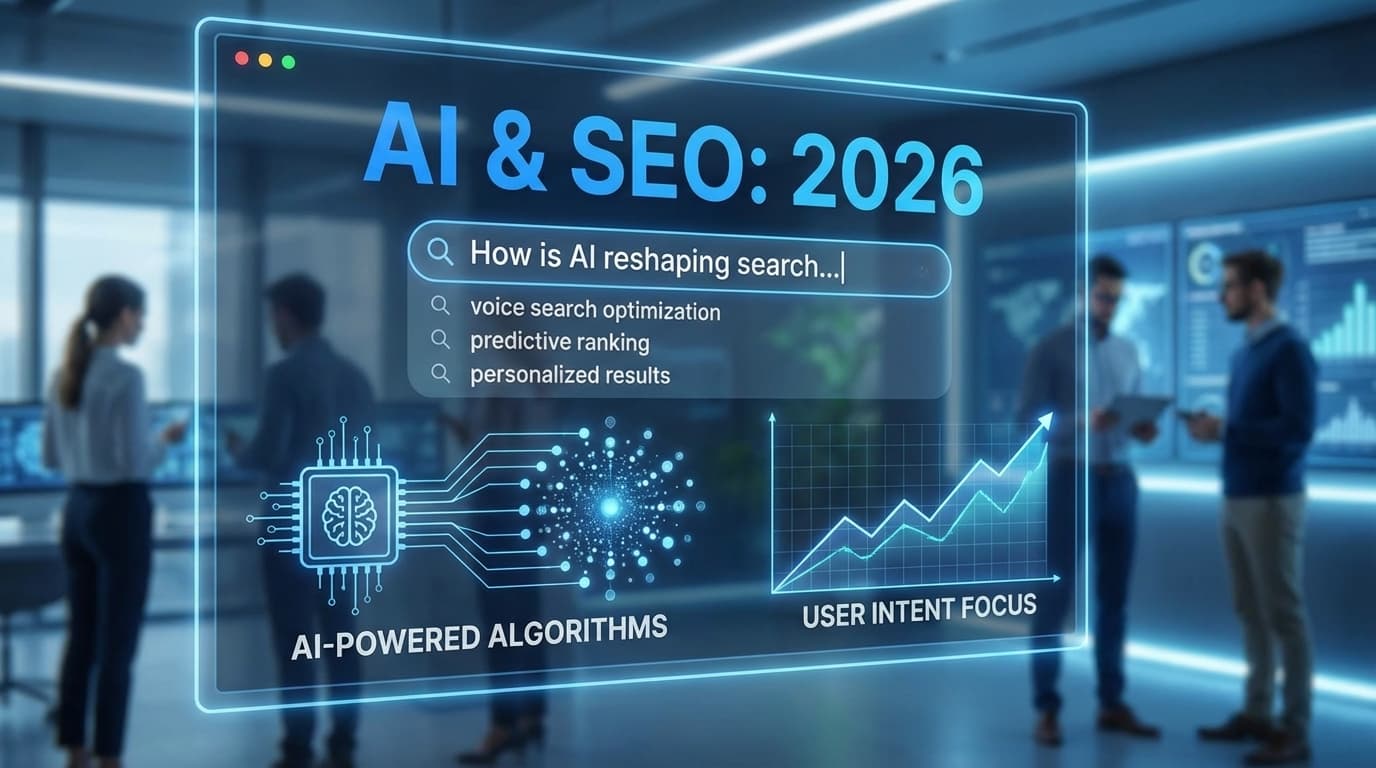
What Is AI Marketing ROI?
AI marketing ROI is the measurable return generated by artificial intelligence tools and strategies applied to marketing activities, calculated as the ratio of net revenue gained to total AI marketing investment. Unlike traditional marketing ROI, AI marketing ROI must account for three additional variables: the cost of AI tooling and infrastructure, the efficiency gains from automation (time saved, resources freed), and the compounding effect of machine learning models that improve over time.
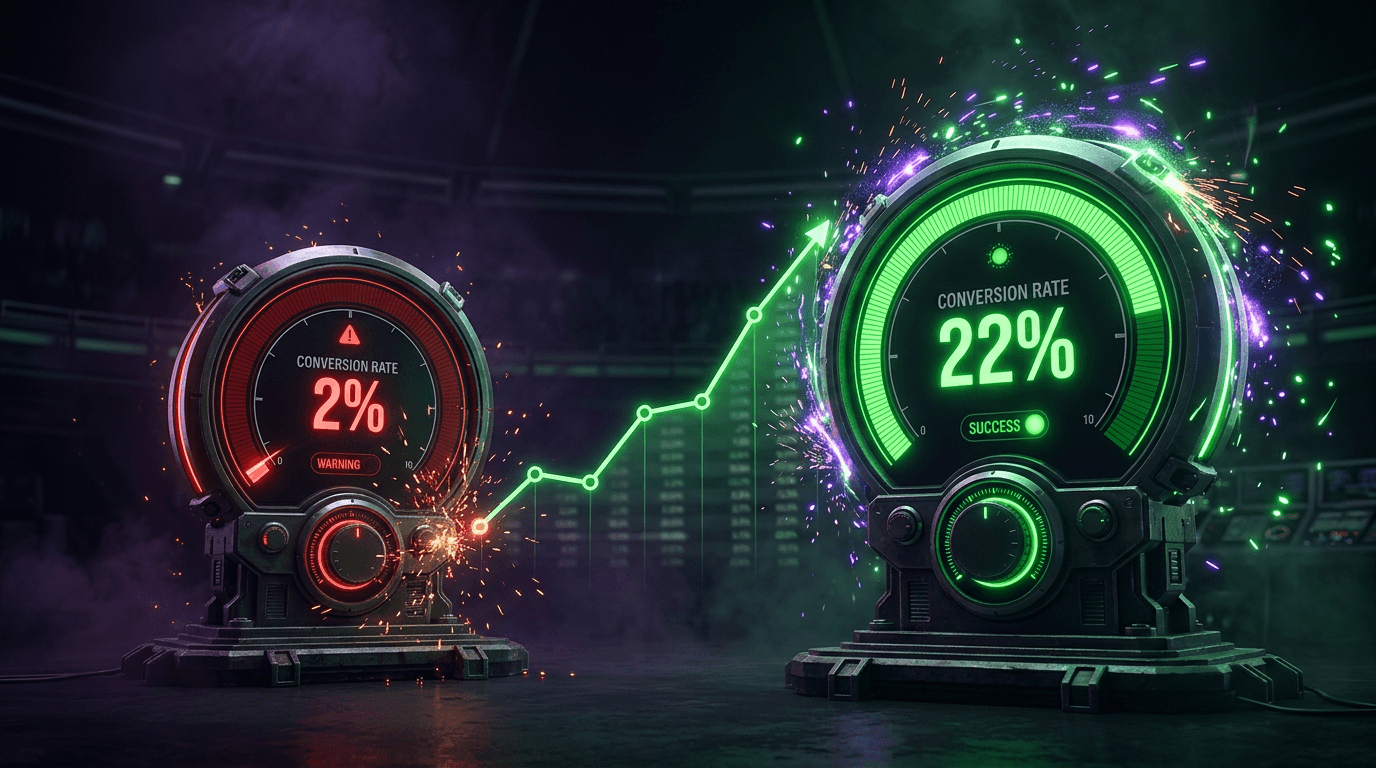
According to McKinsey (2024), AI adopters in marketing report 3-15% revenue uplift and 10-20% marketing ROI improvement compared to non-adopters. The challenge is not whether AI marketing delivers ROI — the data confirms it does — but whether your measurement framework captures the full picture.
The 3-Layer Attribution Framework for AI Marketing
Most marketing teams measure ROI at the campaign level only. That captures perhaps 30% of the value AI delivers. The remaining 70% sits in pipeline acceleration and business outcomes that traditional dashboards miss entirely. Here is the three-layer framework we use at Hovi Digital Lab to measure the full ROI of AI marketing:
Layer 1: Campaign Performance
This is the layer most teams already track — the direct performance of marketing campaigns. With AI, the key metrics shift from vanity numbers to efficiency indicators:
- Return on Ad Spend (ROAS): Revenue generated per dollar spent on AI-driven paid ads. AI typically improves ROAS by 30-50% through dynamic budget allocation and creative optimisation.
- Cost Per Acquisition (CPA): The cost to acquire one customer through AI-optimised channels. Expect 20-40% CPA reduction within the first 90 days as models learn.
- Click-Through Rate (CTR): AI-generated creative and copy consistently outperforms manually created assets. According to HubSpot (2024), AI-powered campaigns see 41% higher click-through rates on average.
- Conversion Rate: The percentage of visitors who take the desired action. AI personalisation can lift conversion rates by 15-30% through dynamic content and audience segmentation.
Layer 2: Pipeline Impact
This layer measures how AI affects the sales pipeline — the bridge between marketing activity and revenue. Many teams skip this entirely, which is why according to HubSpot (2024), only 36% of marketers can prove the ROI of their marketing activities.
- Marketing Qualified Leads (MQLs): Volume and quality of leads generated by AI campaigns. AI lead scoring separates genuine buyers from browsers.
- Sales Qualified Leads (SQLs): Leads that pass AI-driven qualification criteria and are ready for sales engagement. At Hovi, we saw an 800% increase in SQLs for Ohana Hills using AI lead scoring.
- Pipeline Velocity: How fast leads move through the funnel. AI automation compresses follow-up times from days to hours.
- Lead-to-Close Rate: The percentage of leads that become paying customers. This metric captures the compounding effect of AI across the entire funnel.
Layer 3: Business Outcomes
The ultimate measure — what AI marketing means for the business bottom line:
- Revenue Lift: Net increase in revenue attributable to AI marketing. According to Forrester (2024), AI-driven firms are 1.6x more likely to exceed revenue targets than non-adopters.
- Customer Acquisition Cost (CAC): Total cost to acquire a customer across all channels. AI reduces CAC by eliminating waste spend and improving targeting precision.
- Customer Lifetime Value (CLV): AI-powered retention campaigns and personalised experiences increase CLV by deepening customer relationships.
- Marketing Efficiency Ratio: Revenue generated per dollar of total marketing spend, including tools, team, and media. This is the single most important number for CMOs.
8 AI Marketing Metrics That Actually Matter
Not all metrics deserve dashboard space. Here are the eight that consistently correlate with business growth across the 200+ brands we serve:
- Blended ROAS across AI-managed channels — Measures the aggregate return across all AI-optimised campaigns, not individual channels in isolation.
- AI-attributed pipeline value — The total dollar value of sales opportunities created or influenced by AI marketing activities.
- Speed to lead — Time from first touchpoint to first meaningful sales conversation. AI automation should compress this below 4 hours.
- Content production velocity — Volume of marketing assets produced per unit of time. AI content engines typically deliver 5-10x output with the same team.
- Creative win rate — Percentage of AI-generated creative variants that outperform the control. Above 60% indicates a well-trained model.
- SQL-to-close ratio — Measures lead quality, not just quantity. AI scoring should push this above 20% for B2B.
- Campaign optimisation cycles per week — How frequently AI adjusts bids, budgets, and targeting. More cycles equals faster learning.
- Marketing-influenced revenue percentage — The share of total revenue where marketing played a measurable role in the customer journey.
ROI Benchmarks: What Good Looks Like
Based on results across our client portfolio and industry research, here are realistic AI marketing ROI benchmarks by vertical as of 2026:
| Industry | Typical AI Marketing ROI | Time to Positive ROI | Key Metric |
|---|---|---|---|
| Real Estate | 200-400% | 3-6 months | SQL volume and cost per SQL |
| Healthcare / MedSpa | 300-500% | 2-4 months | Patient acquisition cost |
| E-Commerce | 250-600% | 1-3 months | ROAS and AOV lift |
| B2B SaaS | 150-350% | 4-8 months | Pipeline velocity and close rate |
| Education | 200-400% | 3-6 months | Enrollment rate and cost per student |
| F&B / Hospitality | 150-300% | 2-4 months | Reservation volume and repeat rate |
| Beauty / Luxury | 200-500% | 2-5 months | Social engagement and referral traffic |
According to Gartner (2024), CMOs now allocate 25.4% of their budget to marketing technology, with AI tools commanding an increasing share. The brands that measure ROI rigorously consistently outspend competitors — because they can prove the return justifies the investment.
How We Track ROI at Hovi
At Hovi Digital Lab, every client engagement begins with a measurement framework. Before we launch a single campaign, we establish baseline metrics across all three layers and set target benchmarks for 30, 60, and 90-day intervals.
Our approach includes:
- Unified dashboards: We connect ad platforms, CRM, website analytics, and sales data into a single view. No more switching between Google Ads, Meta Business Suite, and HubSpot to understand performance.
- Attribution modelling: We use multi-touch attribution that credits every AI-influenced touchpoint in the customer journey, not just the last click.
- Weekly optimisation reports: Every client receives a weekly summary of key metrics with AI-generated insights on what changed and why.
- Quarterly business reviews: We present Layer 3 business outcomes — revenue influenced, CAC trends, and efficiency improvements — to prove ongoing value.
This framework delivered measurable results across our portfolio: 500% ROI for Waseel, 220% ROI for Ohana Hills, and 810% Instagram referral growth for Bassam Fattouh — all tracked through the same three-layer system.
Common ROI Measurement Mistakes
After working with 200+ brands, we see the same measurement mistakes repeatedly. Avoid these:
- Measuring only Layer 1. Campaign metrics alone miss 70% of AI's value. A campaign with mediocre ROAS might be generating high-quality SQLs that close at 30% — but you would never know without Layer 2 tracking.
- Ignoring the learning curve. AI models improve over time. Measuring ROI after two weeks is like judging a marathon runner at the 100-metre mark. Give models 60-90 days to accumulate enough data for meaningful optimisation.
- Comparing AI costs to zero. The question is not "does AI cost money?" — it is "does AI cost less than the alternative?" Compare AI marketing investment to the traditional agency retainer, in-house team cost, or opportunity cost of slower execution.
- Measuring vanity metrics. Impressions, likes, and followers are not ROI. They are indicators at best, distractions at worst. Focus on metrics that connect to revenue.
- Not accounting for time savings. If AI reduces content production from 5 days to 5 hours, that freed capacity has a dollar value. Most teams fail to quantify this.
- Treating all leads equally. A raw lead count means nothing without quality segmentation. AI lead scoring exists precisely because 100 qualified leads beat 1,000 unqualified ones.
Frequently Asked Questions
How long does it take to see positive ROI from AI marketing?
Most businesses see positive ROI within 60-90 days of implementing AI marketing. Paid advertising channels show results fastest — typically within 3-4 weeks as AI models accumulate conversion data and optimise targeting. SEO and content marketing take longer (4-6 months) but compound over time. The key variable is data volume: businesses with higher traffic and conversion events give AI models more signal to learn from, which accelerates the path to positive ROI.
What is a good ROI benchmark for AI marketing in the MENA region?
Across our 200+ client portfolio in the MENA region, the median AI marketing ROI at 6 months is 250-350%. High performers in e-commerce and healthcare exceed 500%. These benchmarks account for all costs including AI tooling, agency fees, and media spend. The MENA market offers a particular advantage: lower digital advertising costs compared to North America and Europe, combined with high smartphone penetration and growing e-commerce adoption, create a favourable ROI environment for AI-driven campaigns.
How do you separate AI's contribution from other marketing activities?
We use multi-touch attribution combined with A/B testing to isolate AI's contribution. When AI is introduced to a campaign, we maintain a control group (or use historical baselines) to measure the incremental lift. For example, if an AI-optimised ad campaign delivers 40% higher ROAS than the same campaign run manually, the 40% delta is directly attributable to AI. Over time, the attribution model becomes more refined as it accumulates data on which touchpoints drive conversions.
Do I need expensive tools to measure AI marketing ROI?
Not necessarily. The framework itself is tool-agnostic. Google Analytics 4 (free), your CRM's built-in reporting, and platform-native dashboards from Google Ads and Meta provide Layer 1 and partial Layer 2 data. The value of specialised tools lies in unifying data across sources and automating the analysis. For businesses spending under $10K/month on marketing, free tools are sufficient. Above that threshold, investing in unified analytics typically pays for itself within 2-3 months through better optimisation decisions.
How does AI marketing ROI compare to traditional agency ROI?
Based on our benchmarks and industry data, AI marketing consistently delivers 2-3x higher ROI than traditional agency approaches, primarily driven by three factors: faster execution (campaigns launch in days, not weeks), continuous optimisation (AI adjusts hourly, not monthly), and lower overhead (fewer manual hours per campaign). The cost comparison is equally compelling — AI marketing typically costs 40-60% less than traditional agency retainers while delivering measurably better results. For a detailed breakdown, see our AI workflow automation page.
Ready to implement a measurement framework that proves the ROI of every marketing dollar? Book a strategy session with our team. We will audit your current analytics setup and show you exactly where revenue is being left on the table.